

Six Shifts Shaping the 2027 Class
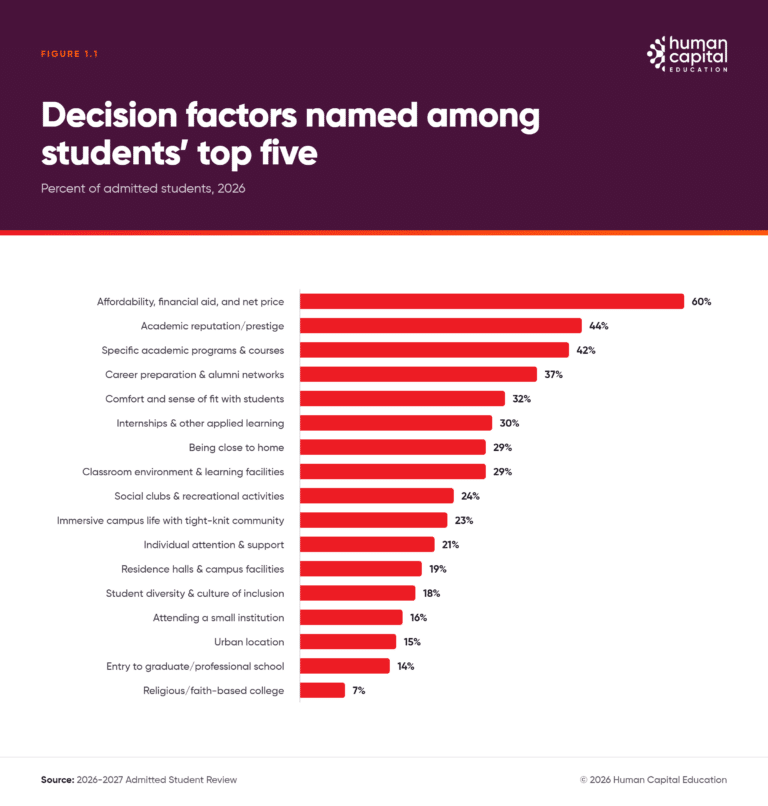
Affordability is still the single biggest factor in a student’s decision to enroll. In the 2026-2027 admitted student survey results, 60% of students listed ‘affordability, financial aid, and net price’ among their top five reasons for choosing a college. However, it is rarely the only thing admitted students weigh when deciding where to enroll. Most admitted students who responded to our admitted student survey are what we have coined as Balanced Explorers. Balanced Explorers are seeking a combination of financial value, career outcomes, campus culture, and location. Increasingly, they are evaluating and weighing those trade-offs later in the enrollment cycle, often up to and beyond the enrollment deadline date.
As higher education leaders evaluate their recently enrolled 2026 class, we are looking forward to the enrollment trends that will carry into the 2027 class and beyond. Human Capital Education’s admitted student survey reached 72,187 admitted students at 91 institutions between May and July 2026, after they had made their fall 2026 decisions. In total, the students we surveyed submitted more than 420,000 applications and named 2,083 different colleges among their top choices. The full findings are in the 2026-2027 Admitted Student Review. Here are the six shifts that matter most for higher ed enrollment leaders shaping the 2027 class.
Key Findings at a Glance
- 52% of admitted students spread their priorities across outcomes, culture, and practical factors instead of concentrating on one.
- 15% waited as close to the notification deadline as possible, up from 11% a year earlier.
- 10% deposited at more than one college in 2026, double the 2024 rate.
- Current students (26%) were rated very influential as often as admissions staff (24%).
- Major concern about the rising cost of attendance reached 33% while most other affordability worries eased.
- 21% said their families are insufficiently prepared to pay for college, up from 17% in 2023.
Affordability Leads, but Students Rarely Choose on Price Alone
Sixty percent of students admitted for fall 2026 named ‘affordability, financial aid, and net price’ among their top five decision factors. Financial considerations are by far the most cited decision factor, and the only point named as a key factor by a majority of respondents. However, it is far from the only key factor in the decision-making process when students consider where to enroll. Academic reputation (44%), specific academic programs (42%), and career preparation (37%) all closely followed financial considerations, and lead to a more nuanced view of the data.
A ranked list of priorities is a valuable window into student motivations. However, looking only at the most important factor in the decision-making process hides how students combine those priorities. Human Capital grouped the survey’s 17 factors into three clusters: academic and career outcomes, campus culture and community, and location and practicality. Over half of students, 52%, spread their weight across all three primary clusters. We call these students Balanced Explorers. A quarter of respondents were classified as Career Maximizers, focused on outcomes, while 17% were Practical Evaluators, weighing location and day-to-day feasibility, and 6% were Culture Seekers.
Pell-eligible, first-generation, and underrepresented students were more likely to be Practical Evaluators. Men and students headed for STEM careers leaned toward Career Maximizers.
As you begin to shape your class for the 2027 recruitment cycle, treat the clusters as a mixing board. An effective communication plan will deliver messaging that appeals to the breadth of factors that enrolling students consider. An optimized communication plan will turn the dials to deliver more impactful messages aligned with a prospective student’s decision persona. Career Maximizers need to hear about outcomes and applied learning. Practical Evaluators seek out information on net cost, travel, and what daily life will require. Balanced Explorers need to see how the pieces fit together. Your admitted pool won’t mirror the national mix, so start with which segments dominate your own admits, including the ones who went elsewhere, and then identify the demographic and behavioral flags that will allow you to customize your messaging.
The Enrollment Decision Now Runs Past May 1
Fewer than half of admitted students decide where to enroll as soon as the acceptance letter arrives. In the 2026 cycle, 42% decided shortly after receiving admission decisions, 29% waited for financial aid offers, and 14% decided after participating in accepted student programs. Twenty-nine percent of students waited for their financial aid package before making a decision, including 36% of first-generation students. Meanwhile, those holding out until the enrollment decision deadline day rose from 11% in 2025 to 15% in 2026.
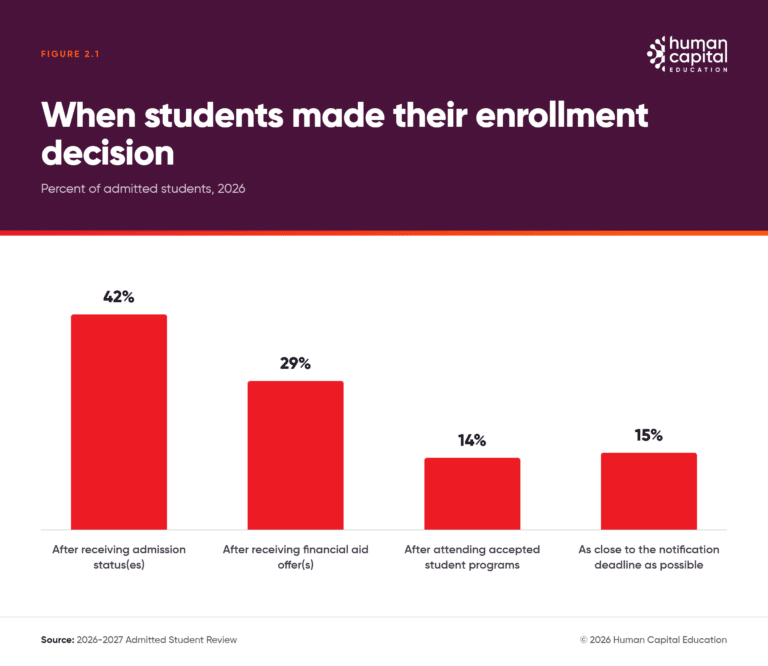
Those waiting right until the deadline day were far from the last to make their final decision. Most recruitment planning calendars still treat May 1 as the finish line. However, the data confirm the thing that has been keeping many admissions officers up at night. Increasingly, the finish line is actually moving into summer, and more students are deferring past the deadline. This has resulted in teams recruiting the next class while still working on landing the current one. A fall 2027 yield strategy has to account for this delay in the decision-making process and build appropriate melt-mitigation and retention strategies. At the same time, the timing of when each message reaches a student plays a critical role in the process. Award timing is an important part of financial aid optimization. Financial aid modeling that tracks admits, deposits, and yield through the cycle uncovers the impact of earlier or clearer offer changes, and the ideal timing for impacting the enrollment decision.
Double Deposits Have Doubled, Meaning Deposit Counts Say Less Than They Used To
Ten percent of admitted students deposited at more than one college in 2026, double from the 5% that double-deposited in 2024. While that matches what enrollment leaders have been telling us for two years, our data shows that it may not mean what seems to be the obvious explanation.
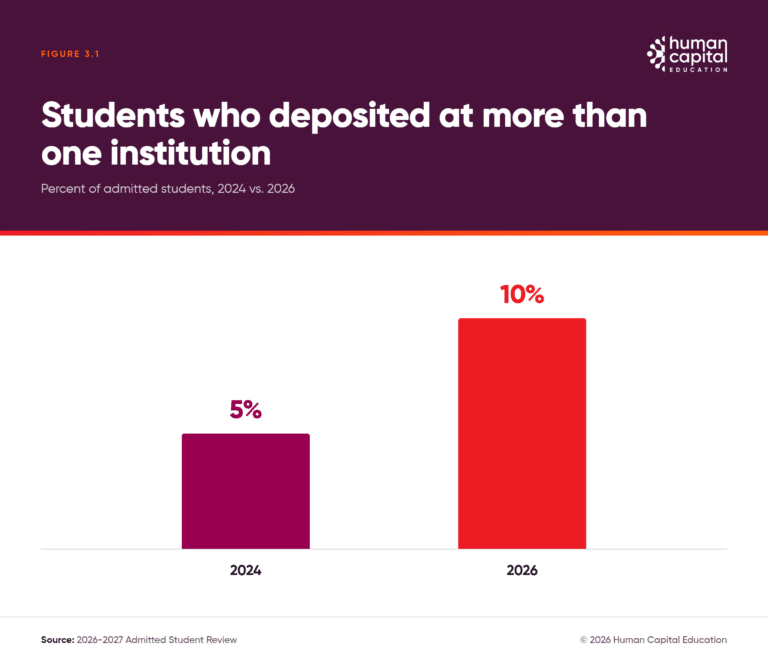
Indecision is the intuitive explanation. However, the data doesn’t support it. While a second deposit tells you another option is still open, it does not explain why. Students who were identified as very certain in their decision double-deposited at an 11.0% rate. Uncertain students double-deposited at a rate of 10.4%.
In contrast, an institution’s profile was a more predictive factor in double-depositing. On Human Capital’s Profile-Demand-Index, a seven-tier measure of an institution’s market position, double depositing reached 21.8% among respondents at Tier 2 colleges and 4.7% at the top tier.
Shaping the 2027 class means creating an additional communication cycle that starts at deposit and runs through the first day of class, with housing, advising, financial aid, and orientation speaking in the same voice that recruited the student. An enrollment analytics dashboard that measures behavior such as portal visits, onboarding steps, and email engagement in-cycle gives a clearer read on summer melt risk than a deposit-to-enrollment ratio.
Current Students Carry as Much Weight as Admissions Staff
Your enrolled students sit alongside the people hired to recruit when it comes to voices to whom prospective students listen. Twenty-six percent of admitted students called current students very influential in shaping how they saw a college, and 24% said the same of admissions staff. Faculty (20%), alumni (19%), and financial aid staff (17%) also influence the decision-making process. Prospective students use conversations with current students to test claims made by marketing messages and recruitment staff. Thirty-two percent named comfort and sense of fit with other students as a top factor, something that is hard to judge from a viewbook. A promise in an admissions email has to hold up in a student-led video, on a campus tour, and in social media posts.
The human connection is also gaining significance after arrival on campus. Internships and applied learning led the experiences students value most for their learning goals (88%). Mentorship in their field (61%) is also highly valued, surging ahead of study abroad (46%).
Affordability Worries Eased, Except About the Cost of Attendance
Interestingly, concern about affordability dropped on most measures this year. The combined share of admitted students reporting at least moderate concern about affordability fell on all eight related questions asked in both 2025 and 2026, and major concern decreased on six of the measurements. However, the rising cost of attendance is a major concern for 33% of respondents, an increase of four percentage points over the prior year. Additionally, more students reported major concern about needing paid work while enrolled.
Cost is also impacting the growing number of admitted students who chose to not enroll in any institution in 2026. Six percent of respondents did not enroll at any college in fall 2026, compared with 3% the year before. The most cited reason was affordability, with 51% of that group saying they could not afford college at this time. Gap years (24%), lost interest in a degree (21%), and military service (4%) accounted for the rest.
Clearer communication won’t fix an inadequate package, but it reduces the confusion that turns uncertainty into a decision not to enroll. Make the full cost of attendance and the terms of aid clear before students commit, then help them plan for how costs change after they arrive. Price transparency is an important element in building an effective tuition and fee pricing strategy.
The Financial Challenge Follows Students to Campus
Twenty-one percent of admitted students in 2026 said their families are insufficiently prepared to pay for college, an increase from 17% of respondents in 2023. You might expect students to take on more of the cost as family capacity tightens. However, the opposite happened across our pool of respondents. Students reporting no involvement in paying for their education rose from 12% in 2023 to 17% in 2026.
While an aid package can make enrollment possible, unanswered financial problems create a retention challenge. Student responses to admitted student surveys help identify at-risk students before they arrive. Predictive student success modeling turns those admission-stage signals into early intervention candidates your student success team can proactively support with an enhanced onboarding sequence. Bring financial aid and student accounts in early, and keep checking after the first bill, before a balance becomes a registration hold or a stopped-out student.
What This Means for Your 2027 Enrollment Strategy
The 2026 cycle stretched the enrollment decision at both ends. Students committed later, more kept a second option open after depositing, and financial uncertainty followed many of them past the first bill. As enrollment leaders develop their 2027 enrollment strategy, these findings help shape engagement and support that goes beyond a May 1 finish line with practical adjustments. Time aid offers and admission decisions against when students actually decide. Build a communication plan that covers from deposit to the first day of class and include departments across campus. Identify early which families are likely at risk for financial uncertainty. An enrollment strategy built around these admitted student trends gives enrollment teams room to do that work and increase your enrollment yield.
These national patterns describe trends across higher education in 2026. The next step is finding the trends in your own admitted students, including those who chose another college or none at all. Download the full 2026-2027 Admitted Student Review, and join the 2027-2028 survey, which begins in spring 2027.
Frequently Asked Questions
What did the 2026-2027 admitted student survey find?
Students admitted for fall 2026 ranked affordability first, with 60% naming it a top factor, but 52% balanced it against outcomes, culture, and location. They also decided later, double-deposited more often (10%, up from 5% in 2024), and reported more family difficulty paying for college (21%, up from 17% in 2023).
What is an admitted student survey?
An admitted student survey asks admitted students why they enrolled or chose somewhere else. Sometimes called an admitted student questionnaire, it is most useful when it reaches students who enrolled elsewhere or not at all, because their answers show where and why a college loses the students it admitted.
When do most admitted students decide where to enroll?
In the 2026 cycle, 42% decided after receiving admission decisions, 29% after financial aid offers arrived, and 14% after accepted student programs. Fifteen percent waited until the notification deadline, up from 11% the year before. First-generation students were more likely to wait for the aid offer.
Are more students submitting deposits at multiple colleges?
Yes. Ten percent of admitted students deposited at more than one college in 2026, double the 5% rate in 2024. Students who were very certain of their choice double-deposited about as often as uncertain students, so a second deposit signals an open option rather than indecision.
Are families less able to afford college than they were?
Students report that they are. In 2026, 21% said their families were insufficiently prepared to pay for college, compared with 17% in 2023, while the share of students not involved in paying rose from 12% to 17%.
What percentage of admitted students don't enroll anywhere?
In the 2026 survey, 6% of admitted students said they were not enrolling at any college in fall 2026, compared with 3% in 2025. Affordability was the most common reason, cited by 51% of that group, followed by taking a gap year at 24%.
What enrollment trends should colleges plan for in 2027?
Plan for a longer decision window, deposit counts that predict less than they used to, and financial pressure that continues after enrollment. Students in the 2026 cycle decided later, double-deposited at twice the 2024 rate, and reported more family difficulty paying, extending enrollment work well past May 1.

By: Liz Colavita
Director of Survey Research, Human Capital Education
Liz Colavita is Director of Survey Research at Human Capital Education. She runs Human Capital’s survey research, largely focused on turning data from the Admitted Student Review into insights on yield, melt, net price, and competitor dynamics. Her work also spans student satisfaction and engagement, housing, and alumni surveys. Prior to joining Human Capital Education, Colavita received her MS from The University of Chicago and BA from Duke University.
Lorem ipsum dolor sit amet, consectetur adipiscing elit. Ut elit tellus, luctus nec ullamcorper mattis, pulvinar dapibus leo.